Overview
According to data from DesInventar, about 64 flood disaster events were reported between 2009 and 2017. UNDP’s Diagnostics Analysis of Climate Change and Disaster Management in Relation to PRSP III reports that floods affected the most important number of people between 1980 to 2010 - representing 90% of people affected by disaster in Sierra Leone. During that period floods affected 221,204 people and killed 145 people (11% of people killed by disaster)
The approach taken in this project to assess flood exposure, vulnerability and risk in Sierra Leone is supported by quantitative evidence identifying the exposure and risk of a number of vital elements at risk. The elements at risk studied are population, housing infrastructure, education infrastructure, and health infrastructure. A scenario has been built upon precedent set by significant floods in the past. This scenario is analysed in terms of the population and housing, education and health infrastructure. The flood risk analysis should be easily understood by policy-makers and sectoral development officials.
Flood Exposure Assessment
The exposure assessment for floods provides vital information about the elements and assets, which are located in the areas at risk of flood inundation or the flood hazard prone areas. The information generated from the assessment are important and useful to and decision-makers as basis for plans and interventions on preparedness, early warning, response recovery, and mitigation. In Sierra Leone, floods primarily affects population, and physical infrastructure such as buildings. It also affects agricultural productivity. However, for this report, the assessment has been limited to analysing the exposure of population and primary physical assets such housing, health facilities, and schools.
The flood hazard assessment identified and mapped at a national level areas at risk of flood inundation. The impact profiles of hazards on different assets are distinctive; they vary depending upon the characteristics of the sectoral assets. The project aims to estimate the impact on the population (male and female), primary physical infrastructure including housing, health, and education.
Methodology for Flood Exposure Assessment
The identification of sectors for EVRA is based on past impacts. Table 7‑1 illustrates what effect a flood will have on the various sectors; for the analysis only primary sectors are considered.
Elements at risk of flood hazard
|
Type of Hazard |
Primary Affected Sectors |
Secondary Affected Sectors |
Others |
|
Floods |
Agriculture |
Industry |
Real estate |
|
Housing |
Power |
Financial institutions |
|
|
Education |
Tourism |
|
|
|
Health |
Trade |
|
|
|
Population |
|
|
- Data Collection: Data relating to the primary sector is collected from a number of reliable sources. The data is created at the district level and is structured in GIS format.
- Application of the GIS tools for EA: The flood hazard assessment and mapping presents the flood hazard maps for river basins and flood plains. GIS tools facilitate overlaying risk flood hazard maps within the identified sectors. The overlapping areas of hazard map and sectoral data allow for the identification of the different elements at risk. This project quantified the number of houses, people’s class, the number of educational buildings, hospitals and health posts and total population in the flood prone areas.
- Analysis of EA: The analysis of the EA provides information about the stock of assets in the flood prone areas.
A combination of sophisticated GIS tools have been used to identify the impacts of floods on the population, housing sector, education infrastructure, and health infrastructure in each of the 14 districts in Sierra Leone.
Population
Population data has been sourced from Statistics Sierra Leone’s Population and Housing Census
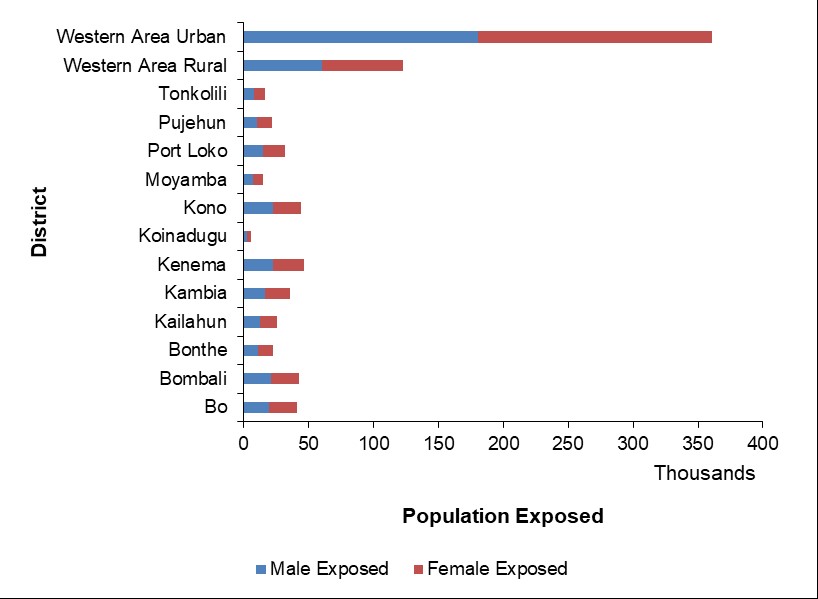
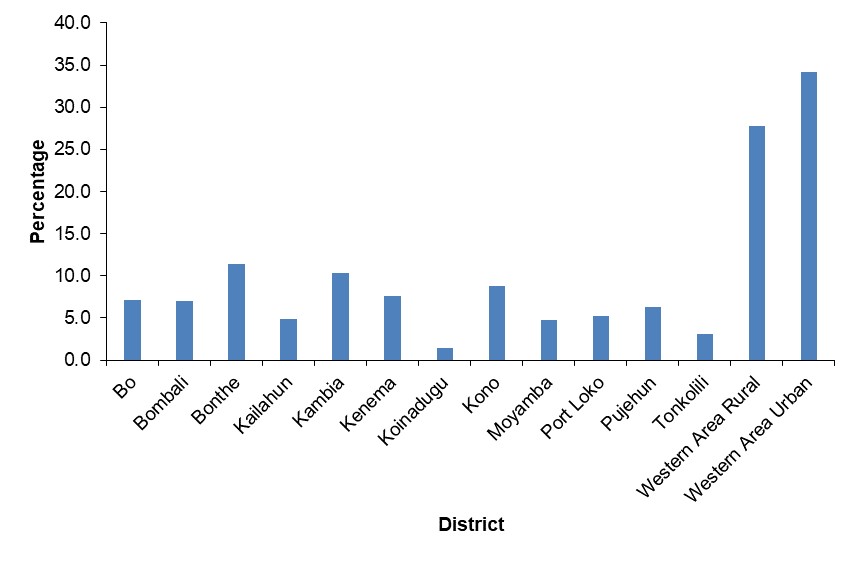
Table 7‑2and Figure 6‑3) show the exposure of population to flood in the 14 districts).
The analysis revealed that cities with the largest population densities have more people exposed to flood. The percentage of population exposed to flood ranges from 1.4 percent (Koinadugu district) to 39 percent (Western Area Rural District). At a national scale about the population exposed to flood is slightly about 10 percent of the total population recorded during the PHC 2015. Table 14‑6 presents a list of communities/sections found to be exposed in flood prone areas.
Population exposed flood
|
District |
Male |
Female |
Total |
Percentage |
District Population |
|
Bo |
19,641 |
21,451 |
41,092 |
7.1 |
575,478 |
|
Bombali |
21,162 |
21,356 |
42,518 |
7.0 |
606,544 |
|
Bonthe |
11,538 |
11,452 |
22,990 |
11.5 |
200,781 |
|
Kailahun |
12,983 |
12,856 |
25,839 |
4.9 |
526,379 |
|
Kambia |
16,849 |
18,756 |
35,605 |
10.3 |
345,474 |
|
Kenema |
23,199 |
23,451 |
46,650 |
7.6 |
609,891 |
|
Koinadugu |
2,819 |
2,901 |
5,720 |
1.4 |
409,372 |
|
Kono |
22,508 |
22,209 |
44,717 |
8.8 |
506,100 |
|
Moyamba |
7,149 |
7,889 |
15,038 |
4.7 |
318,588 |
|
Port Loko |
15,385 |
17,000 |
32,385 |
5.3 |
615,376 |
|
Pujehun |
10,683 |
11,361 |
22,044 |
6.4 |
346,461 |
|
Tonkolili |
8,152 |
8,465 |
16,617 |
3.1 |
531,435 |
|
Western Area Rural |
60,527 |
62,748 |
123,275 |
27.7 |
444,270 |
|
Western Area Urban |
180,470 |
180,139 |
360,609 |
34.1 |
1,055,964 |
|
National |
413065 |
422,034 |
835,099 |
10.00 |
7,092,113 |
Housing Sector
Housing is the second worst affected sector after agriculture. Flooding leads to damage and loss of household items, and impacts on the functionality of the household. There are several complex losses associated with the impact of flooding on housing.
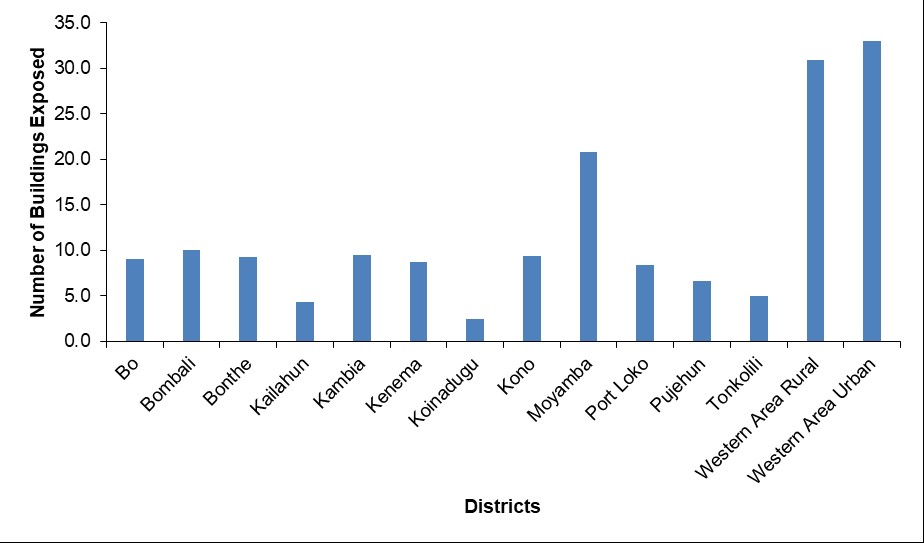
Building datasets for this project have been sourced from OpenStreetMap (OSM, www.openstreetmap.org). A total of about 530,000 buildings have been mapped in the entire country to extract the number of buildings exposed to landslides at moderate, high, and very high risk in the 14 districts.
There are a total of 84,454 (11 percent of the total OSM) buildings are found to be exposed in flood prone areas in the 14 districts, with about 65 percent of that figure from Western Area Rural (24,556) and Western Area Urban (31,082) districts (see Table 6‑7and Figure 6‑6) . The exposure analysis revealed that Koinadugu and Tonkolili districts have the lowest percentages of exposed buildings (2.5 and 5 percent of total number of buildings, respectively).
Buildings exposed to flood
|
District |
Buildings Exposed |
Percentage |
Total Number of Buildings |
|
Bo |
3,625 |
9.1 |
39,989 |
|
Bombali |
3,245 |
10.0 |
32,451 |
|
Bonthe |
330 |
9.2 |
3,570 |
|
Kailahun |
2,826 |
4.3 |
65,366 |
|
Kambia |
1,180 |
9.5 |
12,382 |
|
Kenema |
6,941 |
8.7 |
79,715 |
|
Koinadugu |
440 |
2.5 |
17,772 |
|
Kono |
5,173 |
9.4 |
55,157 |
|
Moyamba |
1,679 |
20.8 |
8,058 |
|
Port Loko |
2,029 |
8.4 |
24,088 |
|
Pujehun |
580 |
6.6 |
8,724 |
|
Tonkolili |
768 |
5.0 |
15,355 |
|
Western Area Rural |
24,556 |
30.9 |
79,520 |
|
Western Area Urban |
31,082 |
33.0 |
94,082 |
|
National |
84,454 |
12.0 |
536,229 |
Education Sector
The exposure assessment for the education sector analyses the exposure of educational institutions (i.e. schools, colleges/universities, and vocational institutions) to floods in areas which have been mapped as at risk of flood inundation.
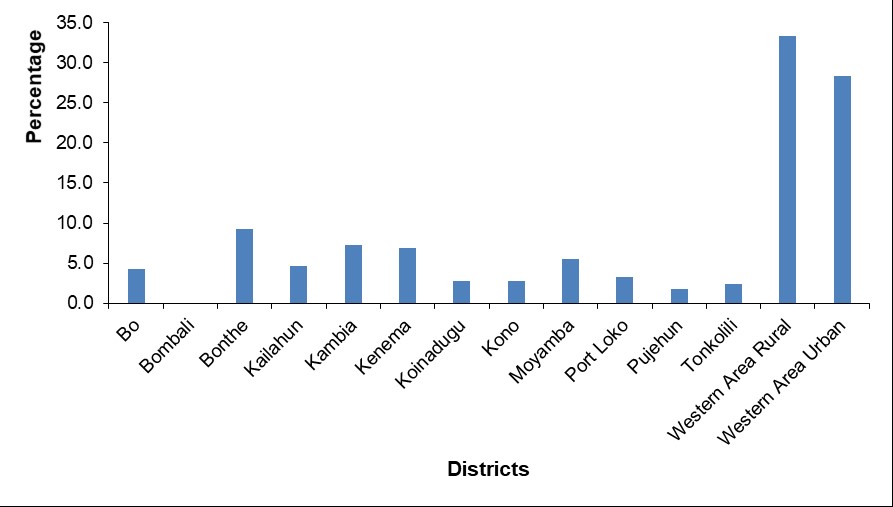
Academic institution datasets have been sourced from UNICEF. A total of about 3330 academic institutions have been mapped in the entire country to extract the number of institutions located in areas at risk of flood inundation. The datasets captures only one academic institution in Bombali District. Therefore, the exposure of academic institutions does not include Bombali District.
The ensuing table and chart (Figure 6‑7 and Table 6‑8) show the exposure of academic institutions to landslides at three risk levels: moderate, high, and very high. A total of in the 13 districts were 261 academic institutions were found to be exposed in flood prone areas, with Western Area alone accounting for over 100 of that figure (see Table 7‑4).
Academic institutions exposed to flood
|
District |
Number |
Percentage |
Total Number of Buildings |
|
Bo |
16 |
4.3 |
375 |
|
Bombali |
NA |
NA |
NA |
|
Bonthe |
10 |
9.3 |
108 |
|
Kailahun |
12 |
4.6 |
259 |
|
Kambia |
11 |
7.3 |
151 |
|
Kenema |
27 |
6.9 |
390 |
|
Koinadugu |
4 |
2.8 |
144 |
|
Kono |
6 |
2.8 |
213 |
|
Moyamba |
21 |
5.5 |
380 |
|
Port Loko |
12 |
3.2 |
373 |
|
Pujehun |
3 |
1.7 |
172 |
|
Tonkolili |
8 |
2.4 |
337 |
|
Western Area Rural |
52 |
33.3 |
156 |
|
Western Area Urban |
79 |
28.3 |
279 |
|
National |
261 |
8.7 |
3,337 |
Health Sector
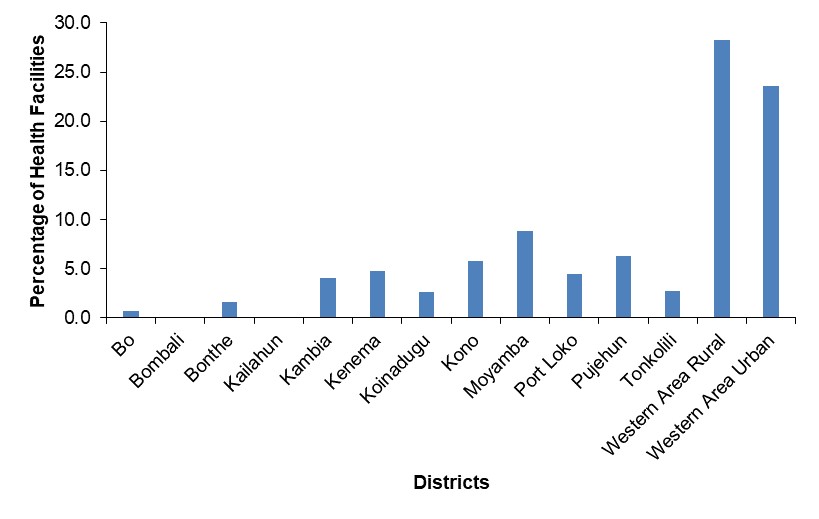
Using GIS analysis a total of 81 health facilities were found to be exposed to floods, with Kailahun and Bombali being the only districts without a health facility located in areas mapped as at risk to flood inundation. Detail of the number of health facilities exposed to floods in the 14 districts are given in Figure 7‑7
Health facilities exposed to flood
|
District |
Number |
Percentage |
Total Number of Health Facilities |
|
Bo |
1 |
0.8 |
133 |
|
Bombali |
0 |
0.0 |
111 |
|
Bonthe |
1 |
1.7 |
60 |
|
Kailahun |
0 |
0.0 |
85 |
|
Kambia |
3 |
4.1 |
73 |
|
Kenema |
6 |
4.7 |
127 |
|
Koinadugu |
2 |
2.7 |
75 |
|
Kono |
5 |
5.7 |
87 |
|
Moyamba |
9 |
8.8 |
102 |
|
Port Loko |
5 |
4.4 |
113 |
|
Pujehun |
5 |
6.3 |
80 |
|
Tonkolili |
3 |
2.8 |
108 |
|
Western Area Rural |
15 |
28.3 |
53 |
|
Western Area Urban |
26 |
23.6 |
110 |
|
National |
81 |
6.7 |
1,317 |