Landslide VA aims to identify the physical and social elements at risk. Quantifying the vulnerability of sectoral assets illustrates the proportion of assets that are located in hazard prone areas. This provides understanding about the stock of asset which may be vulnerable to different landslide hazard severity. The assessment provides information to policy makers, decision makers and planners about assets which may need mitigation intervention. Nevertheless it does not characterize the performance of assets on varying hazard intensities. Thus EA aims to initiate the process of the (Vulnerability and Risk Assessment) VRA.
The impact profiles of hazards on different assets are distinctive; they vary depending upon the characteristics of the sectoral assets. For example landslide primarily affect physical infrastructure, followed by other secondary sectors. The project aims to estimate primary physical infrastructure including housing, education, health, and transport systems. Apart from these, the population is also considered for landslide impacts. Population is further classified by gender (male and female). There are other sectors which are impacted by landslides however the effects are comparatively low and therefore not considered in this study.
Landslide vulnerability assessment helps to provide information, which could be used to protect population and to improve settlement planning, housing sector, infrastructure, and transportation sector. The landslide exposure assessment is limited to the exposure analysis of the following elements at risk: population, housing, health facilities, schools, roads, and agriculture.
The landslide hazard assessment has developed landslide risk maps, which classifies landslide into five risk classes (very high, high, moderate, low and very low). In this landslide vulnerability assessment only moderate, high and very high risk classes are included in the analysis. The two other classes (low and very low) were not included as landslides are less likely to occur at these levels.
How to Read the Map
The landslide hazard map show spatial distribution of risk zones. Colours from green to red indicate the risk classes from very low to very high. The figure below illustrates the colours that are used to indicate the different risk zones from the qualitative assessment of landslide hazard.
|
Hazard |
Descriptor |
Description |
|
Very Low |
Rare |
The event is conceivable, but only under exceptional circumstances |
|
Low |
Unlikely |
The event might occur under very adverse circumstances |
|
Moderate |
Possible |
The event could occur under adverse conditions |
|
High |
Likely |
The event will probably occur under adverse conditions |
|
Very High |
Almost certain |
The event is expected to occur |
A list of communities exposed to landslide at high susceptibility is present in the table below
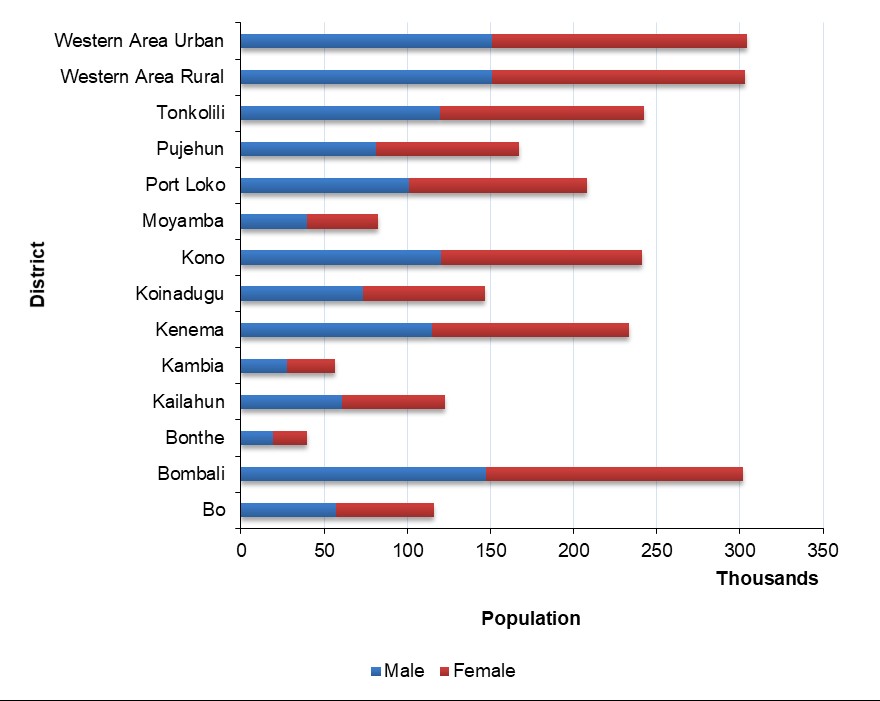
Population vulnerable to landslide at moderate risk
|
District |
Male |
Female |
Total |
Percentage of Population |
District Population |
|
Bo |
57,060 |
59,325 |
116,385 |
20.2 |
575,478 |
|
Bombali |
147,578 |
154,105 |
301,683 |
49.7 |
606,544 |
|
Bonthe |
19,218 |
20,250 |
39,468 |
19.7 |
200,781 |
|
Kailahun |
60,791 |
61,676 |
122,467 |
23.3 |
526,379 |
|
Kambia |
27,617 |
28,942 |
56,559 |
16.4 |
345,474 |
|
Kenema |
114,908 |
118,380 |
233,288 |
38.3 |
609,891 |
|
Koinadugu |
73,205 |
73,460 |
146,665 |
35.8 |
409,372 |
|
Kono |
120,196 |
120,825 |
241,021 |
47.6 |
506,100 |
|
Moyamba |
39,497 |
42,918 |
82,415 |
25.9 |
318,588 |
|
Port Loko |
100,847 |
107,223 |
208,070 |
33.8 |
615,376 |
|
Pujehun |
81,339 |
85,694 |
167,033 |
48.2 |
346,461 |
|
Tonkolili |
119,469 |
122,893 |
242,362 |
45.6 |
531,435 |
|
Western Area Rural |
150,742 |
152,594 |
303,336 |
68.3 |
444,270 |
|
Western Area Urban |
151,242 |
153,039 |
304,281 |
28.8 |
1,055,964 |
|
National |
1,263,709 |
1,301,324 |
2,565,033 |
36.2 |
7,092,113 |
Population vulnerable to landslide at moderate risk